Online polling has a significant role to play in all businesses. You can get genuine feedback from your target audience. These results, in turn, can be used for analyzing the performance of the products and services of the business.
Based on the analysis, you can make an informed decision that helps to improve business tactics. Till now, you might have understood how to design the online polls to get the maximum response rate. Besides, you might have an understanding of how to increase the effectiveness of the online polls. With effective online polls, you can generate useful data.
Apart from getting useful data, it is crucial to effectively present the online poll results. Most often, when the presentation of the received data is not perfect, it misleads the business analyst. They may not be in a position to make an informed decision for the business. It is essential that you use specific ways to enhance the presentation of the online poll results.
Here are five ways in which you can help you in presenting the online poll data. You can use the presentation to make an informed decision.
#1 Embrace Wide Range Of Charts For Presenting The Data
Usually, charts and graphs are considered the best way to visually represent the data. When you are using charts and graphs, you generate the ability to display results in a meaningful way. Embracing interactive charts for the online poll results, you can conveniently convey the information to your audience. If you are making use of non-interactive or basic charts, it may cause confusion. High-quality and interactive charts support in conveying an accurate analysis.
You can get the highlights of the survey result and also the relationship between different types of data. You can know about the latest trends and a complete understanding of the data. You can use line charts, pie charts, bar graphs, and Venn diagrams to display the survey results.
#2 Use Different Infographics To Effectively Display The Survey Results
Making use of infographics is another effective way to display the survey results and analyze them. In the infographic, you and have a combination of graphs, charts, and other statistics to study the poll data in a simple and convenient way. You may wonder why you should make use of infographics. It is because the infographics are attractive and help you to make an impact on the people analyzing the survey data.
#3 Employ Data Visualization Tactics Through Dashboards
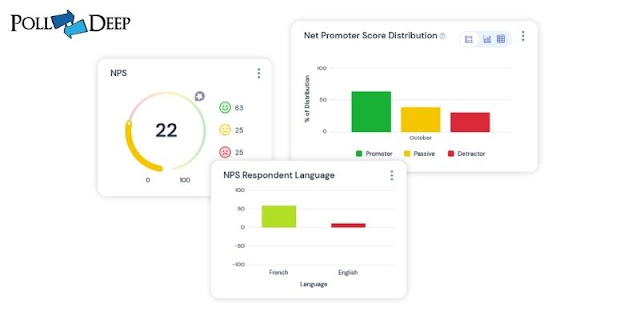
The dashboard refers to the visual description of the data. You can employ dashboards for viewing and analyzing the poll results. You can easily link the dashboard to the database and display data in the form of charts, graphs. With the help of the dashboard, you are visualizing numbers in the form of charts. Moreover, it is better for the human brain interpretation because we can process the images better than the numerical data.
You can use the visual representation not just for business analysis but also to present it to your target audience. It is a better way to convey or advertise your business.
To make the dashboard more interactive, you can customize it according to your preferences. You can change the representation element, colors, and description.
#4 For Displaying Geographical Data, You Can Use A Map
When you want to display geographical data in visuals, you can use the maps. Through maps, you can highlight specific areas and location that requires more attention. For instance, if you want to target the audience belonging to a specific community or area, then it becomes easy to visualize through maps. It is an effective way to analyze the results of the poll.
#5 Focus On Presentations
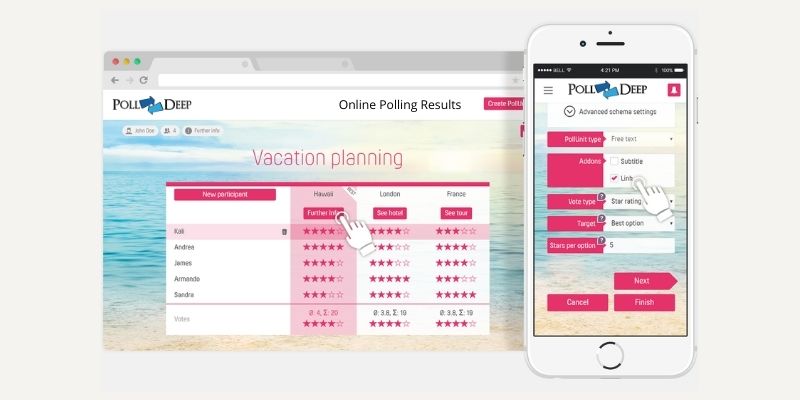
There are multiple presentation tools that are offered by online poll creation platforms. You can make use of any of these presentation tools to improve the visualization of your poll results. It helps you decipher the numbers, data, and even statistics in a perfect way.
Summary
If you want to display your survey results perfectly, use the online poll creation platform - PollDeep. You can get free and premium features for creating the polls, sharing them, and analyzing the data. All you have to do is to register yourself on PollDeep and get started. You can check out all the features available and use them as per your preferences.


No comments:
Post a Comment